
Body Shop
Solution overview
| Issues | Solutions |
|---|---|
| Maintaining and managing welding quality by monitoring the welding conditions constantly | Monitor the quality fluctuation and alarms with an Xbar-R control chart. |
| Reducing the defect rate by measuring the width of welded vehicles from both sides | Monitor the quality in real time with an Xbar-R control chart and a histogram. |
| Lowering the defect rate by inspecting for welding defects (blowholes, height, misalignments, etc.) | Detect welding defects with a vision sensor and a laser displacement sensor. |
| Improving an operating rate by monitoring the operations of welding robots | Visualize the robot operation status and identify the cause of troubles with e-F@ctory starter package. |
| Improving energy efficiency of a belt conveyor and reducing cost by eliminating an enclosure | Control a belt conveyor by a high-performance, energy-saving S-PM geared motor. |
| Collecting and analyzing data by a PLC for preventive maintenance | Collect the vibration data of fragile reducers and analyze the collected data by a PLC. |
Solution details
Reducing the defect rate by measuring the width of welded vehicles from both sides
Lowering the defect rate by inspecting for welding defects (blowholes, height, misalignments, etc.)
Improving and operating rate by monitoring the operations of welding robots
Improving energy efficiency of a belt conveyor and reducing cost by eliminating an enclosure
Collecting and analyzing data by a PLC for preventive maintenance
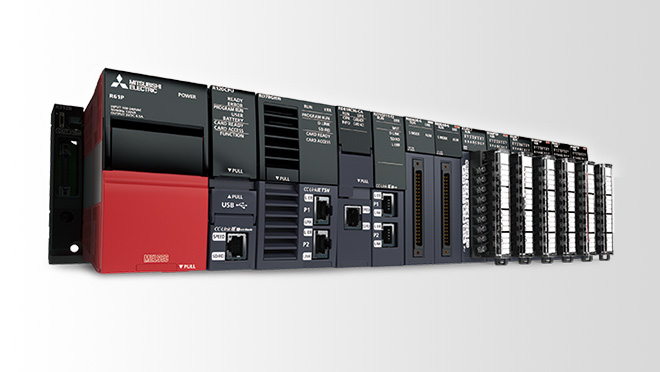
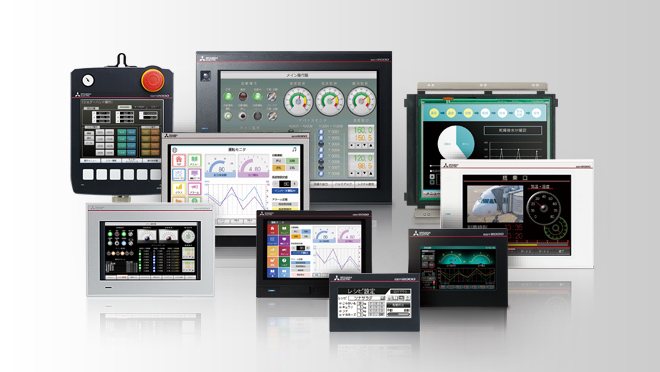
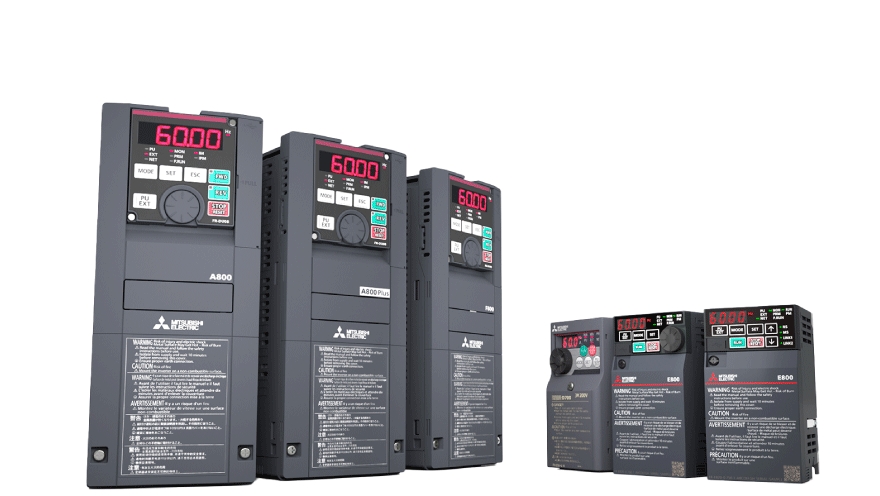
Product Lineup
Competencies
![Carbon Neutral [Solution Overview]](https://eu-images.contentstack.com/v3/assets/blt5412ff9af9aef77f/blt699d31ee03d051c7/65d46f875d80ec040add88e6/img_carbon-neutral-index.jpg?auto=webp&quality=100&format=jpg&disable=upscale)
![Total Maintenancen [Solution overview]](https://eu-images.contentstack.com/v3/assets/blt5412ff9af9aef77f/blt66dfae382bb58ff8/687f4d4d0ff061bc5d806673/img_total-mainte-index.jpg?auto=webp&quality=100&format=jpg&disable=upscale)
![Energy Systems [Solution overview T]](https://eu-images.contentstack.com/v3/assets/blt5412ff9af9aef77f/blt853c263ab291e068/65e9957e4f1756040a016e9d/energy-systems-solutions.jpg?auto=webp&quality=100&format=jpg&disable=upscale)
![Safety [Solution Overview T]](https://eu-images.contentstack.com/v3/assets/blt5412ff9af9aef77f/bltd54d45cf91d2c440/673dec2c1e14c356b7e12682/Safety_bluegray.jpg?auto=webp&quality=100&format=jpg&disable=upscale)
Our Stories

![[Thumbnail] Renault E-Motor Production](https://eu-images.contentstack.com/v3/assets/blt5412ff9af9aef77f/blt360bb15cdf329a7b/6758266c46e305c5f1171d0a/renault_group.jpg?auto=webp&quality=100&format=jpg&disable=upscale)
2023-11-07
E-Motor Production
Renault Group
Watch the video on YouTube
#Automotive#Digital Manufacturing#Programmable Controllers MELSEC#Visualization

Download PDF
DE#Automotive#Material Handling#Controllers#Human-Machine Interfaces (HMIs) - GOT#Industrial Robots - MELFA


